Telegram Engagement Rate: Formula, Benchmarks, and Tracking
Learn how to calculate telegram engagement rate, see realistic benchmarks by channel size, and track ERR automatically for any public channel in real time.
2.3% is a usable global baseline for Telegram engagement rate, though a healthy mid-sized channel is better read as a 1%–6% ERR: average post views divided by subscribers, times 100. The formula is simple. The benchmark isn't.
Telegram channels don't compete inside one algorithmic feed the way Instagram or Facebook pages do. A subscriber count tells you how many people joined. Views per post tell you how many of them still pay attention. A channel can grow while its denominator fills with dormant subscribers, abandoned accounts, and people who stopped opening its messages.
What Telegram Engagement Rate Measures
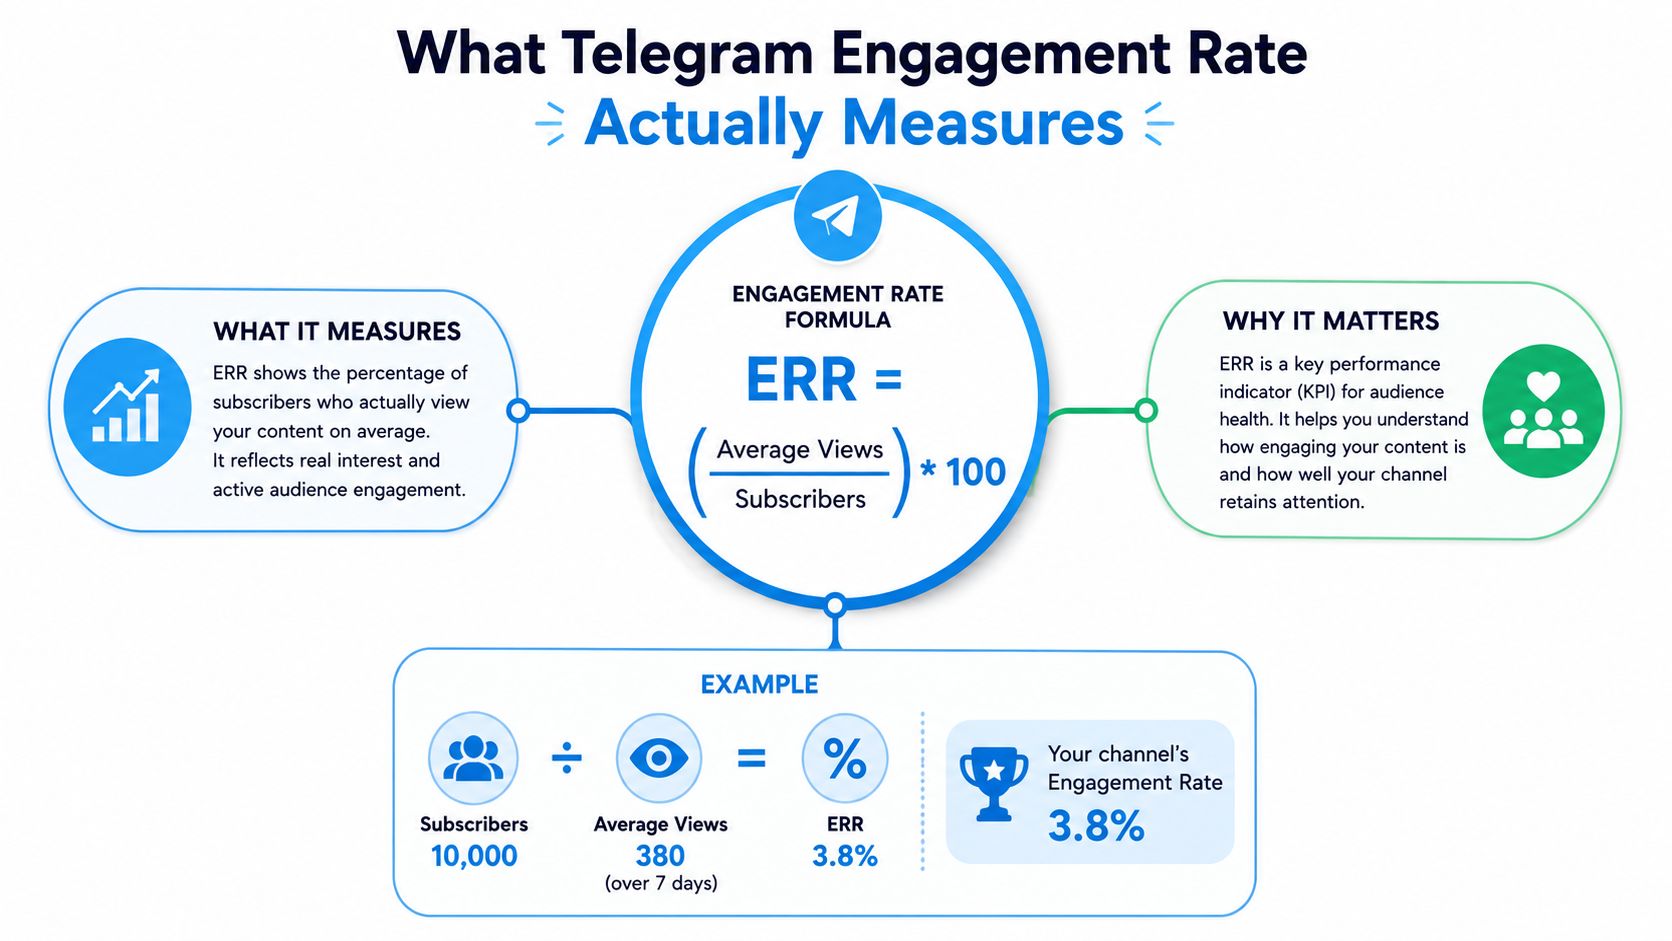
The standard Telegram engagement rate formula is:
ERR = (Average Views ÷ Subscribers) × 100
For a channel with 10,000 subscribers and 380 average views per post over the last seven days:
(380 ÷ 10,000) × 100 = 3.8% ERR
Roughly 3.8 of every 100 subscribers opened a typical post during the period. It counts no reactions, comments, or forwards — this is a reach-based engagement rate, usually written ERR, or engagement rate by reach.
Why views are the starting point
A Telegram view records when a user opens a message, which makes ERR a practical proxy for attention. It answers one narrow question: how much of the subscriber base did the post reach?
Published guides use at least three definitions:
- Views divided by subscribers, the ERR formula used for reach benchmarking.
- Interactions divided by views, where reactions, comments, and forwards measure active response.
- Hybrid composites, which combine reach and interactions under their own weighting rules.
Each definition pairs a different numerator with a different denominator, so no two reported benchmarks can be compared until you know which formula produced them.
The Three Formulas in Use and Why They Disagree
One hypothetical channel shows why Telegram benchmarks contradict each other. Assume 10,000 subscribers, 380 average views per post, 12 reactions, 3 comments, and 25 forwards.
| Formula | Numerator | Denominator | Resulting ERR |
|---|---|---|---|
| Views/subscribers | 380 average views | 10,000 subscribers | 3.8% |
| Interactions/views | 12 reactions + 3 comments + 25 forwards = 40 interactions | 380 views | 10.5% |
| Weighted hybrid | Weighted reaction, comment, and forward score | 10,000 subscribers | 4.1% |
The 10.5% figure isn't wrong. It measures interaction intensity among people who viewed the post, not subscriber reach, and a post with few views can produce a high interaction rate when its small audience responds hard.
The 3.8% figure hides a different weakness. A channel carrying many inactive subscribers has a bloated denominator that suppresses ERR even when the active audience responds well. Picking a formula is a strategic decision, not a technical footnote.
Recent benchmark guidance ranges from about 2%–6% up to 12% or higher in niche-specific tables, and those numbers aren't interchangeable because the definitions and the channel populations differ. Creaflow's engagement benchmark discussion is useful precisely because it exposes that conflict instead of averaging it away.
Choosing the Right Time Window for a Stable Number
Engagement rate moves with the observation window. A 24-hour reading works for launch-day monitoring, but one unusually good post dominates it. It tells you what happened right after publication, not what the channel normally delivers.
A 30-day window smooths daily volatility while concealing recent audience fatigue, a new format that has just started working, or any other recent change in publishing.
The practical default is a seven-day window across the last 20 posts, assuming the channel publishes enough to fill that sample. It balances current behavior against enough posts that neither a viral item nor a single dud defines the benchmark.
| Window | Best use | Main weakness |
|---|---|---|
| 24 hours | Launch-day monitoring | Highly reactive to outliers |
| 7 days, last 20 posts | Routine benchmarking | Requires a meaningful recent sample |
| 30 days | Longer-term trend reporting | Lags behind recent changes |
Keep the window consistent when comparing channels: a competitor's 30-day figure means nothing next to your seven-day result. Use the short window to react, the seven-day window to manage, and the long window to review direction.
Realistic Benchmarks by Channel Size
A single benchmark misleads, because channel size changes the quality of the denominator. These ranges use the views/subscribers formula, a seven-day window, and the last 20 posts.
| Channel Size | Subscriber Range | Healthy ERR Range | Notes |
|---|---|---|---|
| Nano | Under 5K | 8%–20% | Small audiences can be highly concentrated |
| Micro | 5K–25K | 5%–12% | Topic fit often remains visible in reach |
| Mid | 25K–100K | 2%–6% | A practical comparison tier for many brands |
| Large | 100K–500K | 1%–3% | Dormant and inactive subscribers weigh more heavily |
| Mega | 500K+ | 0.5%–2% | Fractional ERR can still represent substantial reach |
The bands normalize several published benchmark sets, all of which report lower view-to-member ratios as channels grow. ChannelOS's Telegram engagement benchmark gives size-specific ranges that make the same point: the same percentage doesn't mean the same thing at every scale.
A 1.4% ERR is weak for a nano channel and respectable for a mega one. Find your subscriber count in the table, then confirm your comparison uses the same formula and window.
Large channels have a denominator problem. Years of growth leave them holding dormant subscribers and inactive usernames, while smaller channels keep a tighter relationship between membership and readership. That doesn't excuse weak content, but scale-related compression isn't evidence of declining quality either — and it's why channel valuations price views rather than subscribers.
How to Compute Engagement Rate for Any Channel Automatically
Manual calculation is easy once and error-prone forever after. For public channels, Statiko's channel catalog and search gets you to the underlying record faster.
A defensible workflow:
- Find the public channel. Search by handle in the catalog. Public-channel analysis needs no ownership or admin access.
- Load the channel record. Review recent post views, forwards, and reactions, then calculate ERR from average views divided by subscribers.
- Fix the measurement settings. Use the same post count and window for every channel, and only compare readings across windows when you know why they differ.
- Inspect the individual posts. An aggregate average conceals one viral message or a cluster of weak ones.
- Save the channel URL or export the figures. Consistent snapshots beat a one-time lookup.
Statiko tracks every post, edit, and deletion in public channels, preserving the record as the content changes. The guide to Telegram channel analytics has more on reading post-level performance.

Record the formula beside the percentage every time. A channel can post a strong interaction-to-view rate and a weak views-to-subscriber rate at once, and without the formula the number isn't portable.
Using Edit and Deletion History to Audit Your Numbers
Post views say nothing about how the content reached its final form. A channel can rewrite a caption after publication, remove weak posts, and reshape the archive that anyone later uses to compute an average.
That's a survivorship problem. When low-performing posts disappear, the surviving archive makes the channel look healthier than its real publishing history. When a post is rewritten after early viewers saw it, one view count now covers two different pieces of content.
What the archive can reveal
A complete lifecycle record preserves:
- The original publication timestamp.
- Each edit event and the version that changed.
- The deletion event and its timestamp.
- The relationship between the current post and its earlier state.
Sorting the archive by edit count exposes posts that changed repeatedly. A post whose current view count runs materially above its pre-edit count points to a mid-flight rewrite that drew a different response. Deletions matter for the same reason: their absence quietly removes weak observations from your sample.
Telegram edit history covers that audit angle in more detail. The lesson is short: a clean 4% ERR is more credible than a 6% calculated from curated survivors.
Why Forwards Matter More Than Raw Views
Views measure exposure. Forwards measure a deliberate distribution decision. That makes forwards the companion metric whenever the question is whether a post can travel past the channel's existing audience.
Forwards per 1,000 views = Forwards ÷ Views × 1,000
A post with 5,000 views and 120 forwards produces 24 forwards per 1,000 views — a rate that compares across channel sizes in a way raw forward totals never do.
| Channel | Subscribers | Avg views/post | Forwards/post | Headline ERR | Forwards per 1k views |
|---|---|---|---|---|---|
| A | 50,000 | 1,000 | 50 | 2% | 50 |
| B | 50,000 | 2,500 | 20 | 5% | 8 |
Channel A has weaker headline reach and stronger forwarding behavior, which suggests its active readers find the content more distributable even while the subscriber denominator drags the ERR down.
Forwards can also start a second layer of sharing when recipients reshare again — a leading signal, not proof of total reach. The guide to Telegram forward messages connects per-post forwarding with broader channel monitoring.
Measurement Pitfalls That Skew Every Benchmark
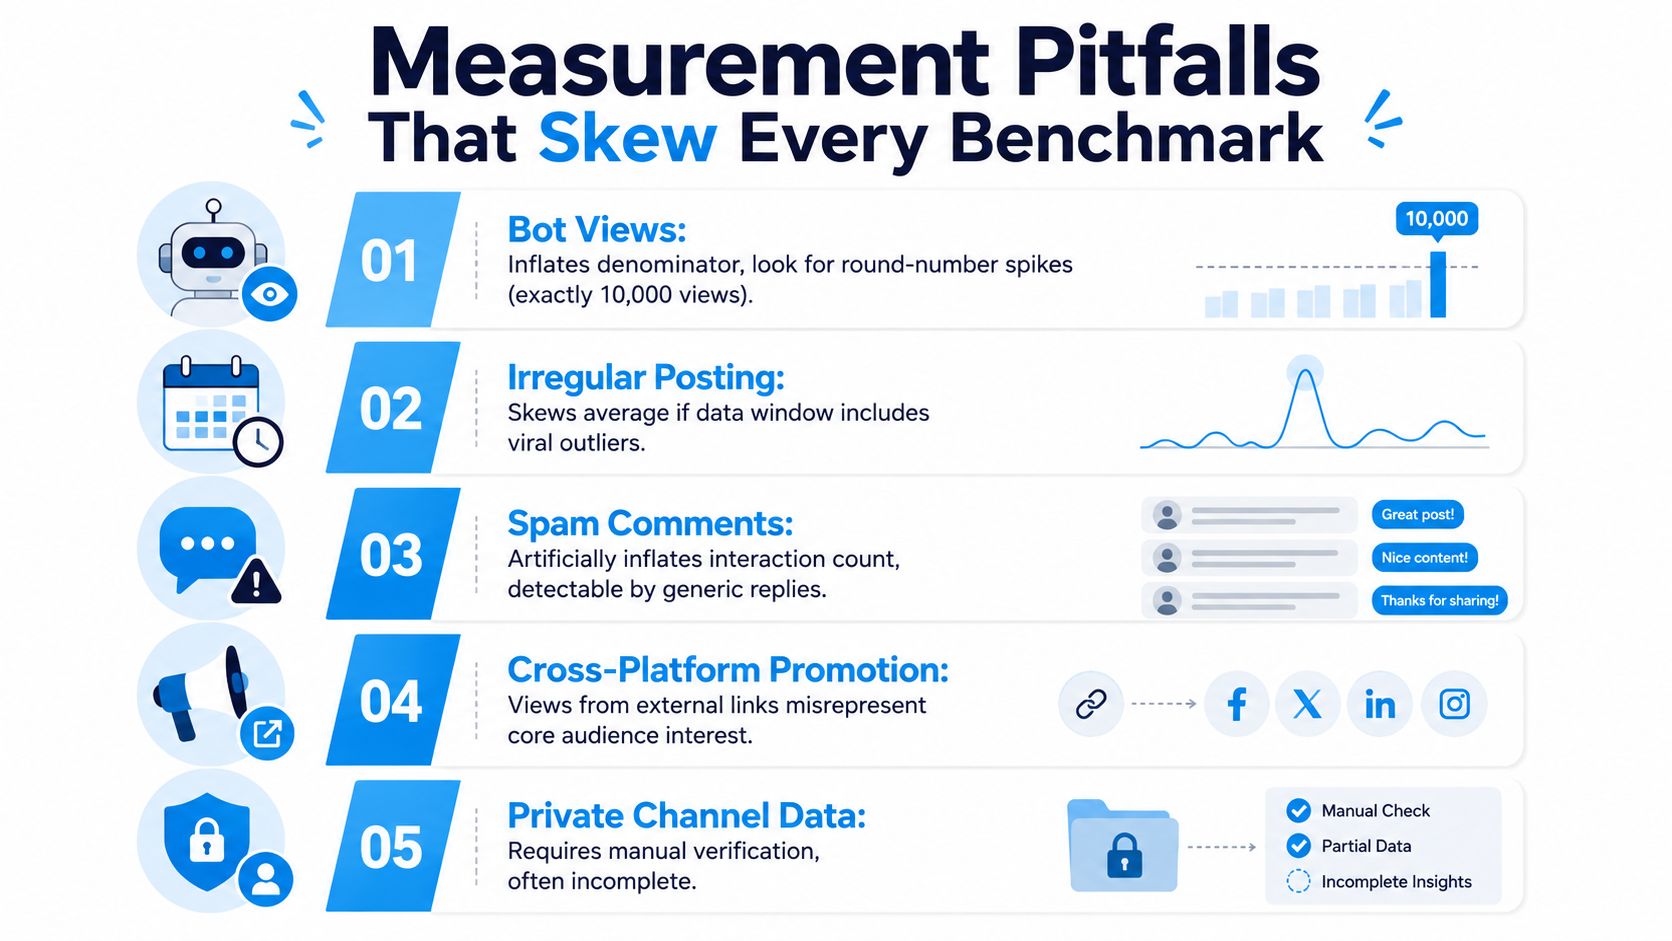
Five distortions move ERR without reflecting genuine interest:
- Bot views: round-number spikes, such as exactly 10,000 views, and view curves that never decay overnight.
- Irregular posting: a window holding one viral post makes the average look stronger than the normal content mix.
- Spam comments: generic replies inflate interaction-based formulas without adding participation.
- Cross-platform promotion: external links bring temporary visitors who don't represent the core subscriber audience.
- Private channel data: private channels need manual verification, so those benchmarks can't be reproduced.
Copied reposts create a sixth problem. The same message appears under several channel identities and looks independently successful in each. Compare text similarity and publication context before counting repeated posts as separate creative wins.
A forward count means something when forwarded posts produce downstream reactions or further distribution, not when they land in inactive contact lists.
Statiko vs Native Telegram Stats and TGStat
The right analytics source depends on the question.
| Feature | Native Telegram Stats | TGStat | Statiko |
|---|---|---|---|
| Public-channel coverage | Primarily channels you own | Broad public coverage | Broad public coverage |
| Edit history | Limited | Not available as a full timeline | Full edit timeline |
| Deletion history | Limited | Not available as a full timeline | Deletion records |
| Update cadence | Channel dashboard updates | Catalog-based analysis | Real-time monitoring |
| AI narrative recaps | Not a core feature | Not a core feature | AI-generated summaries |
Native statistics suit admin-only self-monitoring. TGStat is built for public-channel discovery and ranking. Statiko fits analysts who need public-channel ERR auditing, historical forensics, and narrative interpretation next to the raw records.
Actionable Strategies to Lift Your Engagement Rate
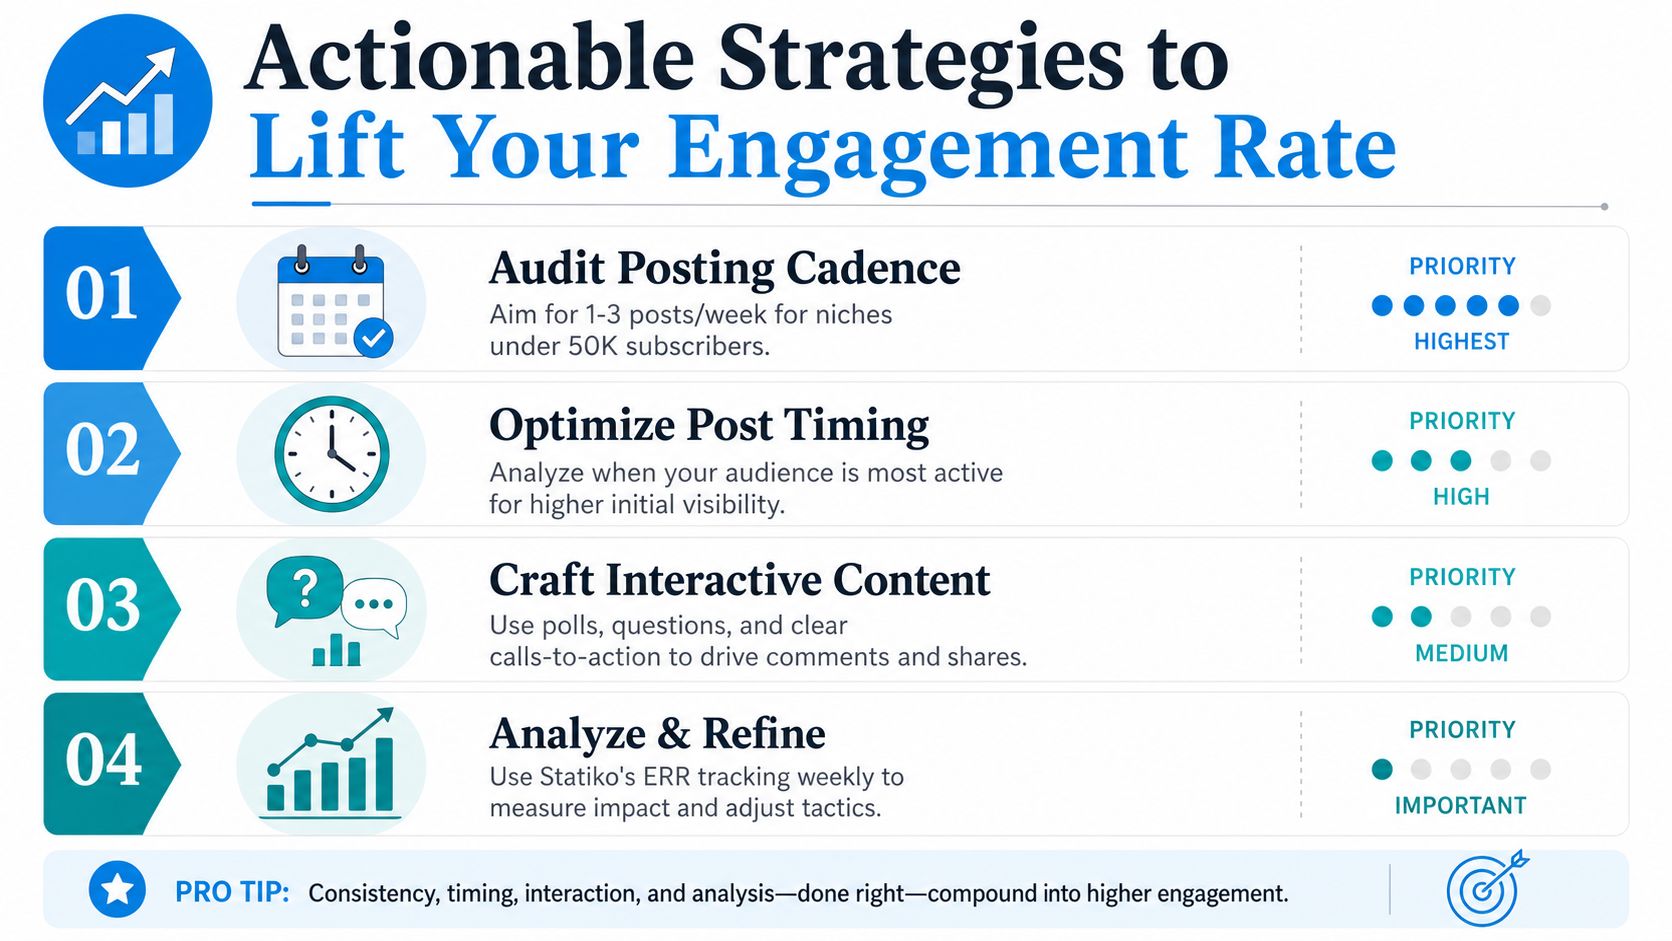
Treat improvement as a controlled experiment rather than a hunt for a universal benchmark.
- Audit cadence. Test whether fewer, stronger posts lift your seven-day baseline. Smaller niche channels often do better at one to three posts per week, but judge that against your own readings.
- Change one format. Replace a long text post with a poll or short video, then compare reach and interaction depth.
- Test timing. Shift the publishing window and compare the next group of posts against the prior baseline.
- Add a recurring question. Measure whether reactions, comments, and forwards rise after a clear weekly prompt.
The goal isn't a higher percentage. It's a cleaner relationship between subscribers, views, meaningful interactions, and distribution.
FAQ
What is a good engagement rate for a Telegram channel? It depends on size. Under 5,000 subscribers, 8%–20% ERR is normal; at 100,000 and above, 1%–3% is healthy. Compare against channels in your own size band and niche, using the same formula and time window.
How do I calculate Telegram engagement rate? Divide average views per post by the subscriber count and multiply by 100. Use the last 20 posts over a seven-day window so a single viral post doesn't define the result.
Why is my Telegram engagement rate falling as the channel grows? The denominator grows faster than active readership. Dormant subscribers and abandoned accounts stay in the count, so ERR compresses at scale even when the content performs as well as before. Check whether average views are actually falling, or only the ratio.
Should I measure views or reactions? Both, separately. Views over subscribers measures reach; reactions and forwards over views measure response among the people reached. A channel can look strong on one and weak on the other, so a single blended number hides the diagnosis.
Can I check a competitor's engagement rate? Yes, for public channels. Views, subscriber counts, reactions, and forwards are all publicly visible, so ERR can be calculated from outside without admin access.
Do bot views affect engagement rate? Yes, and they inflate it. Round-number view counts and view curves that don't decay overnight are the usual signs. Cross-check reactions and forwards, since inflated views rarely come with matching interaction.
Statiko records public-channel posts, edits, deletions, views, forwards, and engagement signals, so you can benchmark Telegram channels without leaning on a single opaque percentage. Search a channel on Statiko, inspect its history, and build an engagement-rate baseline you can defend.
Related posts

Unlock growth with our guide to Telegram channel analytics. Learn to track key metrics, analyze competitors, and make data-driven decisions for your channel.

Run a complete Telegram channel audit before paying for ads or sponsorships. Subscriber history, ER, deletion patterns, and audience geography explained.

Forward on any device, control what the 'Forwarded from' tag reveals, block forwards out of your own chats, and track where your posts travel.
Start in seconds.
Create a free account to organise channels, track activity, and get recaps delivered to you.
Real-time. Telegram. Analytics.